WRONG SIDE OF THE TRACKS | MAP EXPLORATION
Focusing on the Roanoke Valley Area, this project highlights poverty and education trends within targeted areas in Roanoke, specifically the city in the North West areas. By using public archives of information, such as the US Census and Arc GIS, maps were created using QGIS to gain an understanding of trends within the counties. As the user scrolls through the website they are able to watch the map transform as it highlights important information about poverty and education, as well as their evolution over 5 years. The story boxes on the side aim to provide a story and background for the user to engage with, as well as house vital information such as keys and legends. All maps were created using QGIS and public archive information, all data was sourced by hand.
Completed July 2022.
Programs Used: QGIS, Visual Studio Code, MapBox, Esri, HTML, CSS.

Research Process
This project was very research heavy, and required proper data collection to ensure it accurately told the story of division among Roanoke County Residents. The first step to identifying the “problem” was conducting research surrounding an economic and cultural issue that was happening current day in the Blue Ridge Mountain Region. I began by searching for news articles and research papers from verifiable and trustworthy sources. While collecting these materials my understanding of the issue grew congruently with my recognition that the problem I was highlighting was far larger than a physical geographic boundary line set by the Norfolk Southern Railway in Roanoke, Virginia. The two main concerns that were highlighted in the background research were the disparities in educational attainment (college and highschool degree) and poverty rates (specifically extreme poverty rates).
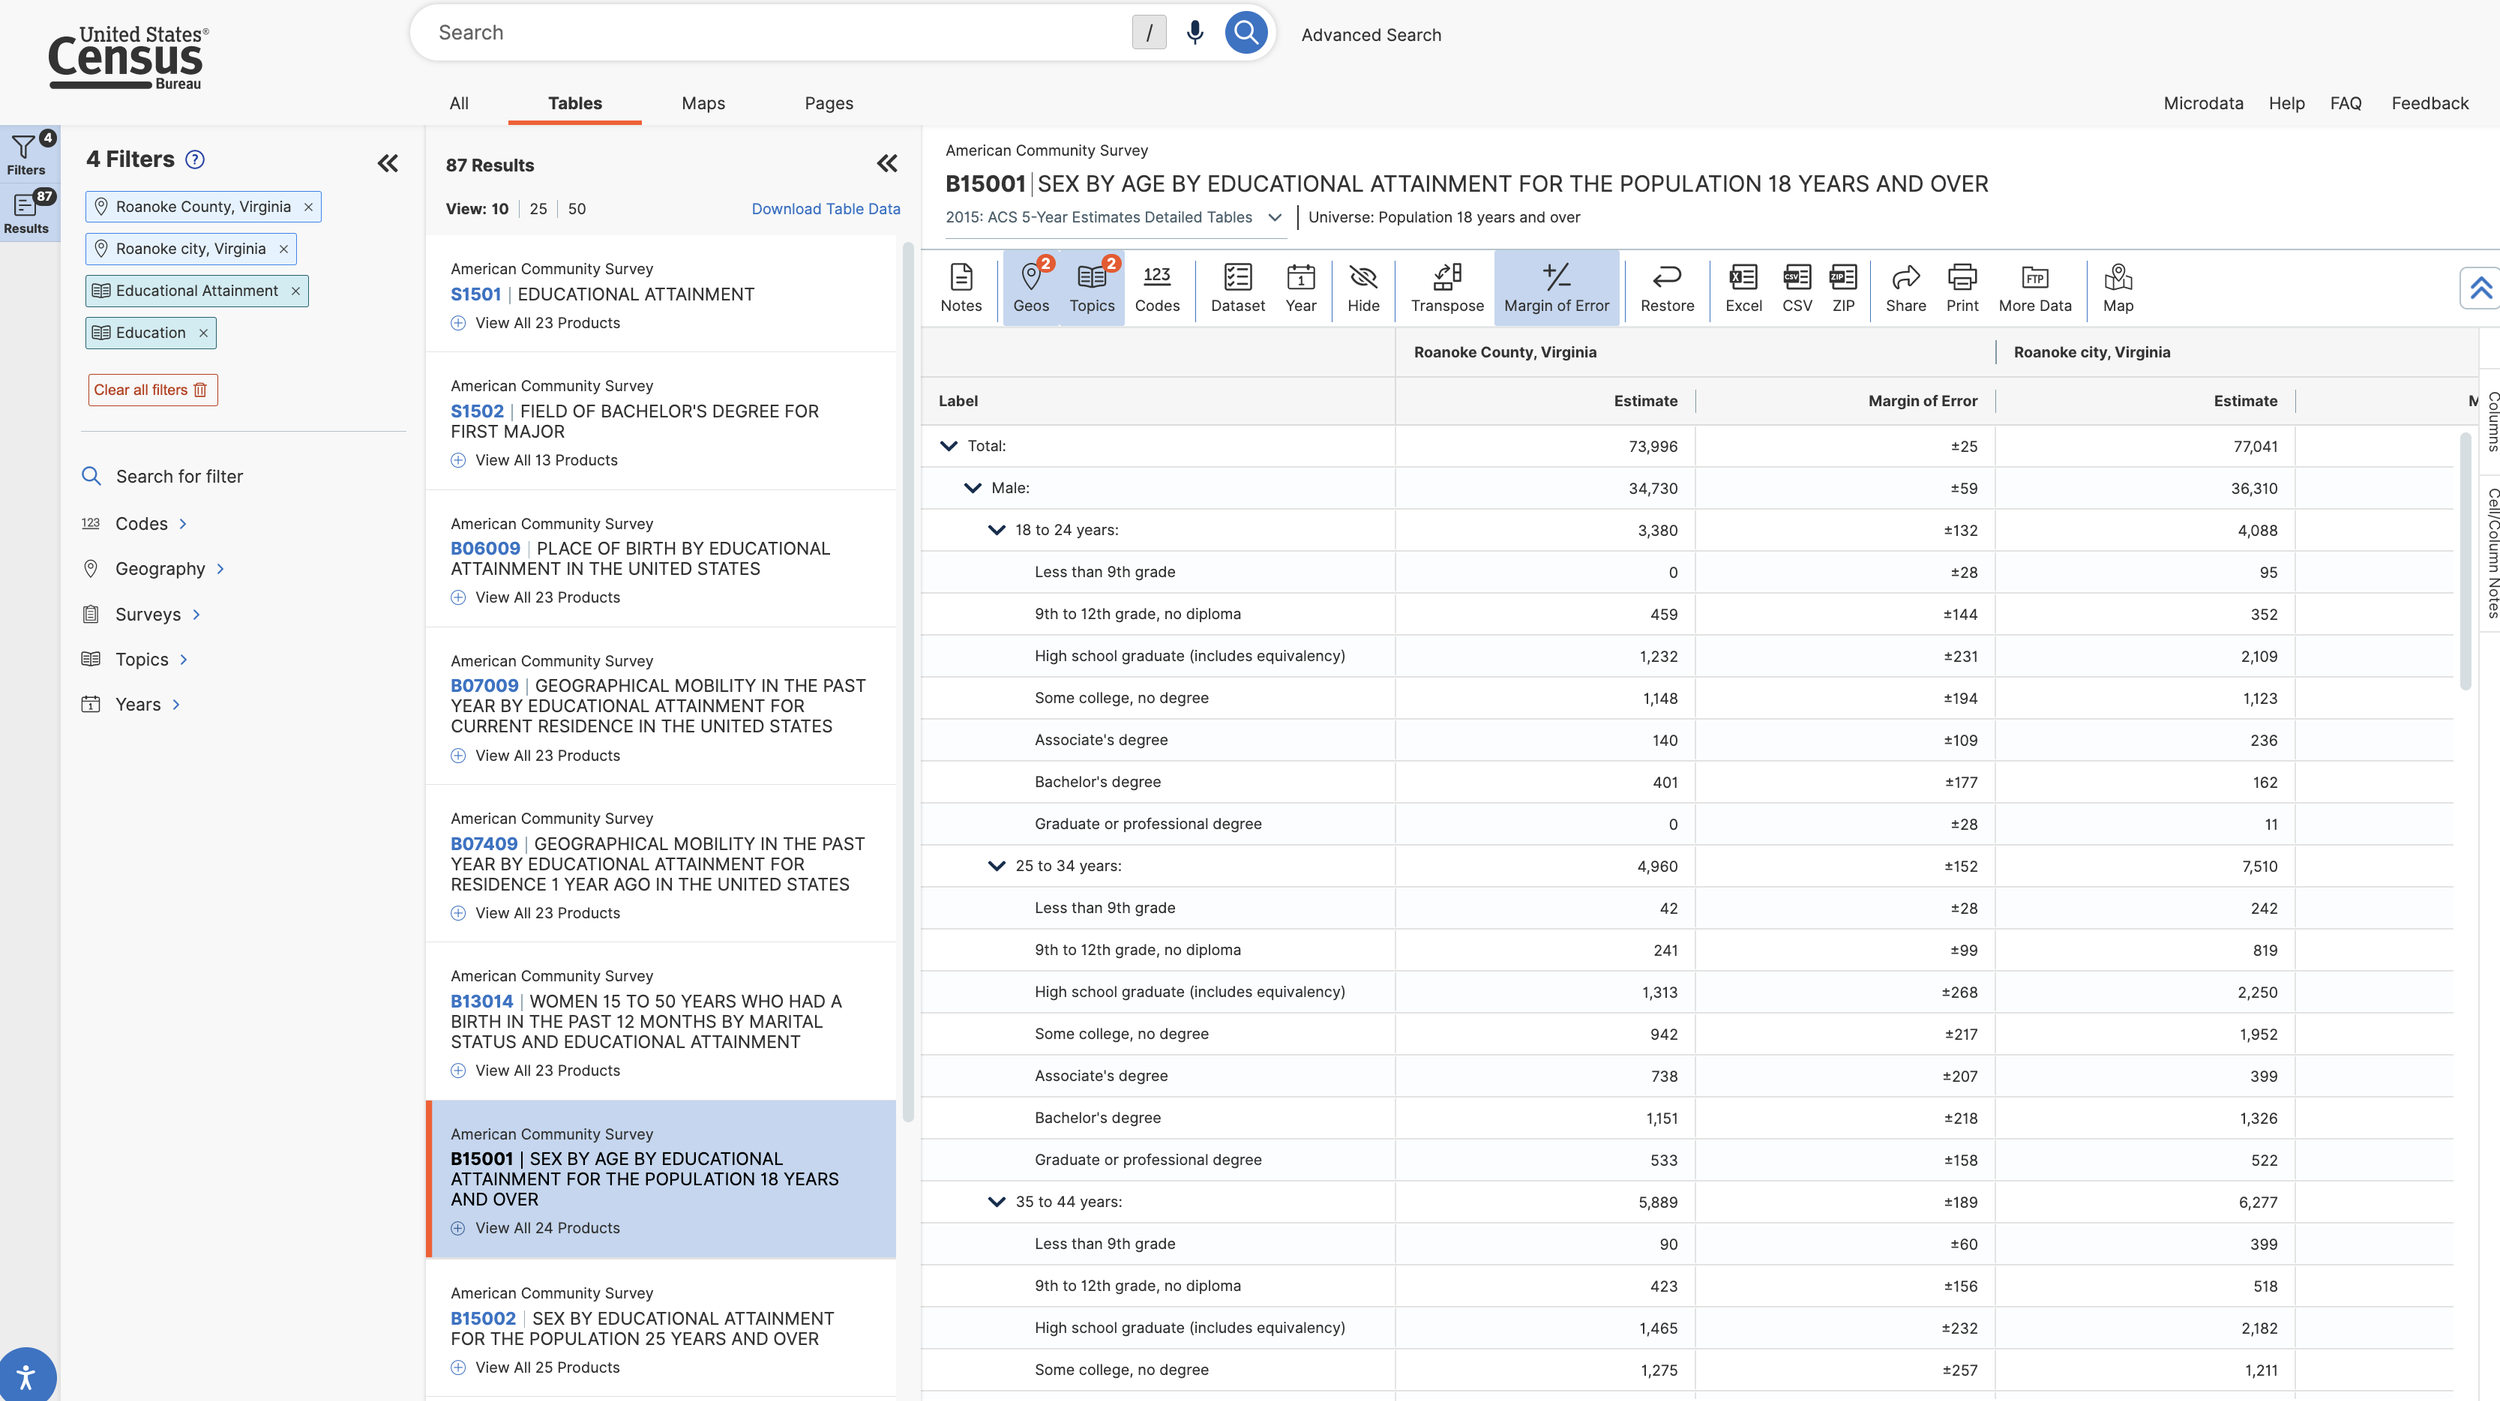
Data Collection from US Census Website
The United States Census website contains census information for up to 20 years back-log. For this project I was not focusing on the historic side of the problem, but rather the current-day implications of the historic segregation. Due to my focused timeframe, I pulled data from the 2015 and 2020 census, the US census is updated on a 5-year basis, making these two time frames the most up to date. By pulling from two time-frames I am able to identify any trends in the data over the past five years, and can confidently use this information to guide my storyline and project.
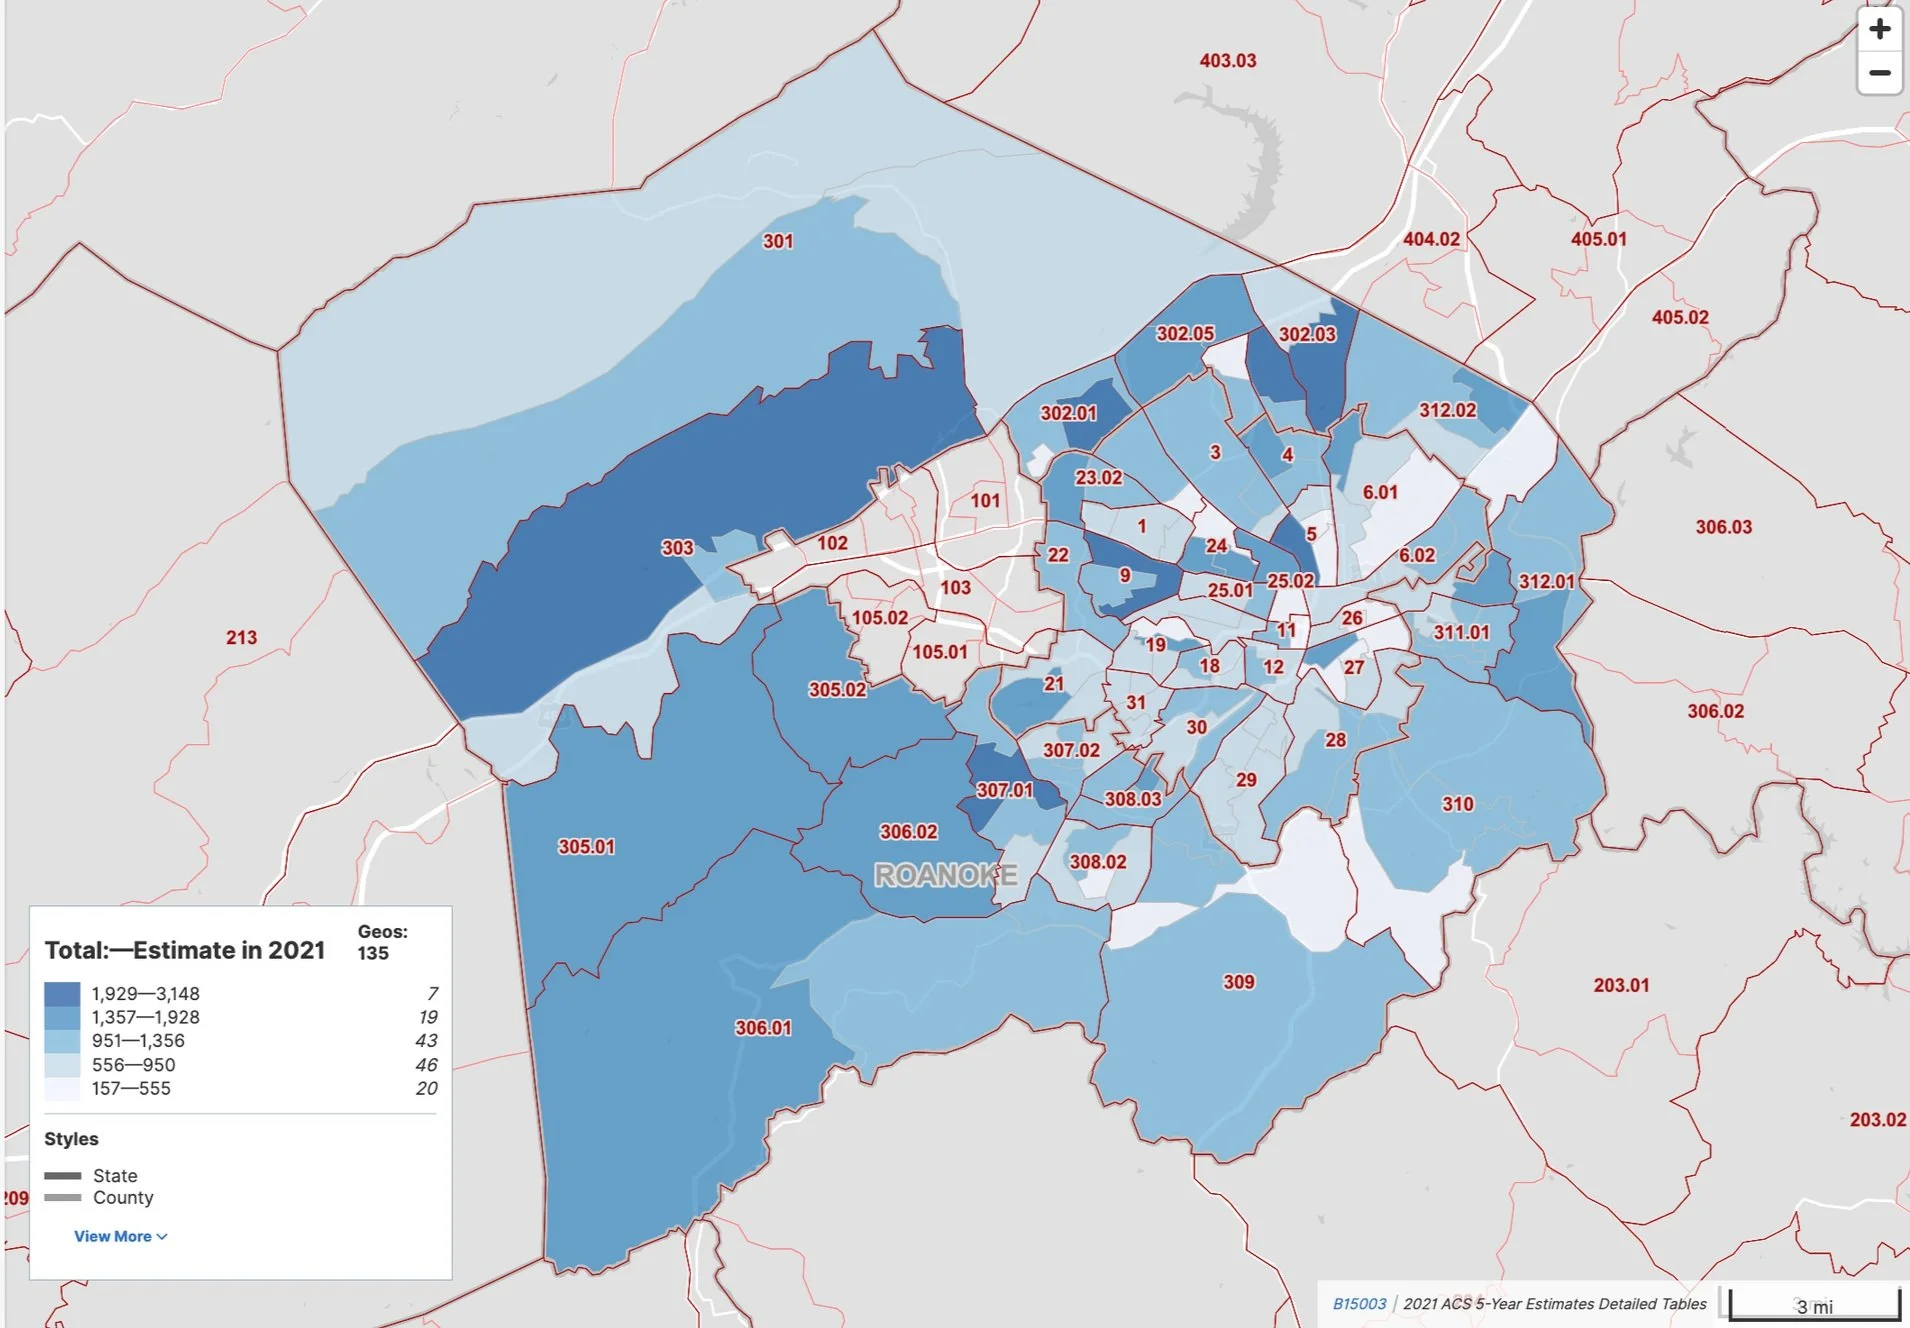
The census collects information for hundreds of categories and thousands of specific locations. To ensure I could look not only at the whole Roanoke area, but all the small sub-groups and communities that make up the collective Roanoke Valley Area, I filtered by block-groups (specific locals). By filtering at a block-group level I could see in depth numbers that pertain to specific small areas, which is important when I am analyzing the data for the specific dividing line created by the railroad.
Education and Degree Attainment
Education plays a large role in salary rates, with higher educational attainment correlating with higher salaries. As a variable in the makeup of wealth, education was a category of the census I wanted to explore, specifically if there was any correlation between the education levels and income levels.
The blue location marker on the map highlights the hub-center for the Norfolk Southern railroad, therefore marking the divide between North and South Roanoke. Education defined in this map is relating to an associates or highschool degree. As the green color gets darker on the map, the level of “no education reported” increases. As shown in the map, the highest concentration of “no education reported” is in the Northwest quadrant of Roanoke County, north of the Norfolk Southern railroad. This is consistent with trends found state and nationwide for educational attainment and historical segregation/gentrification.
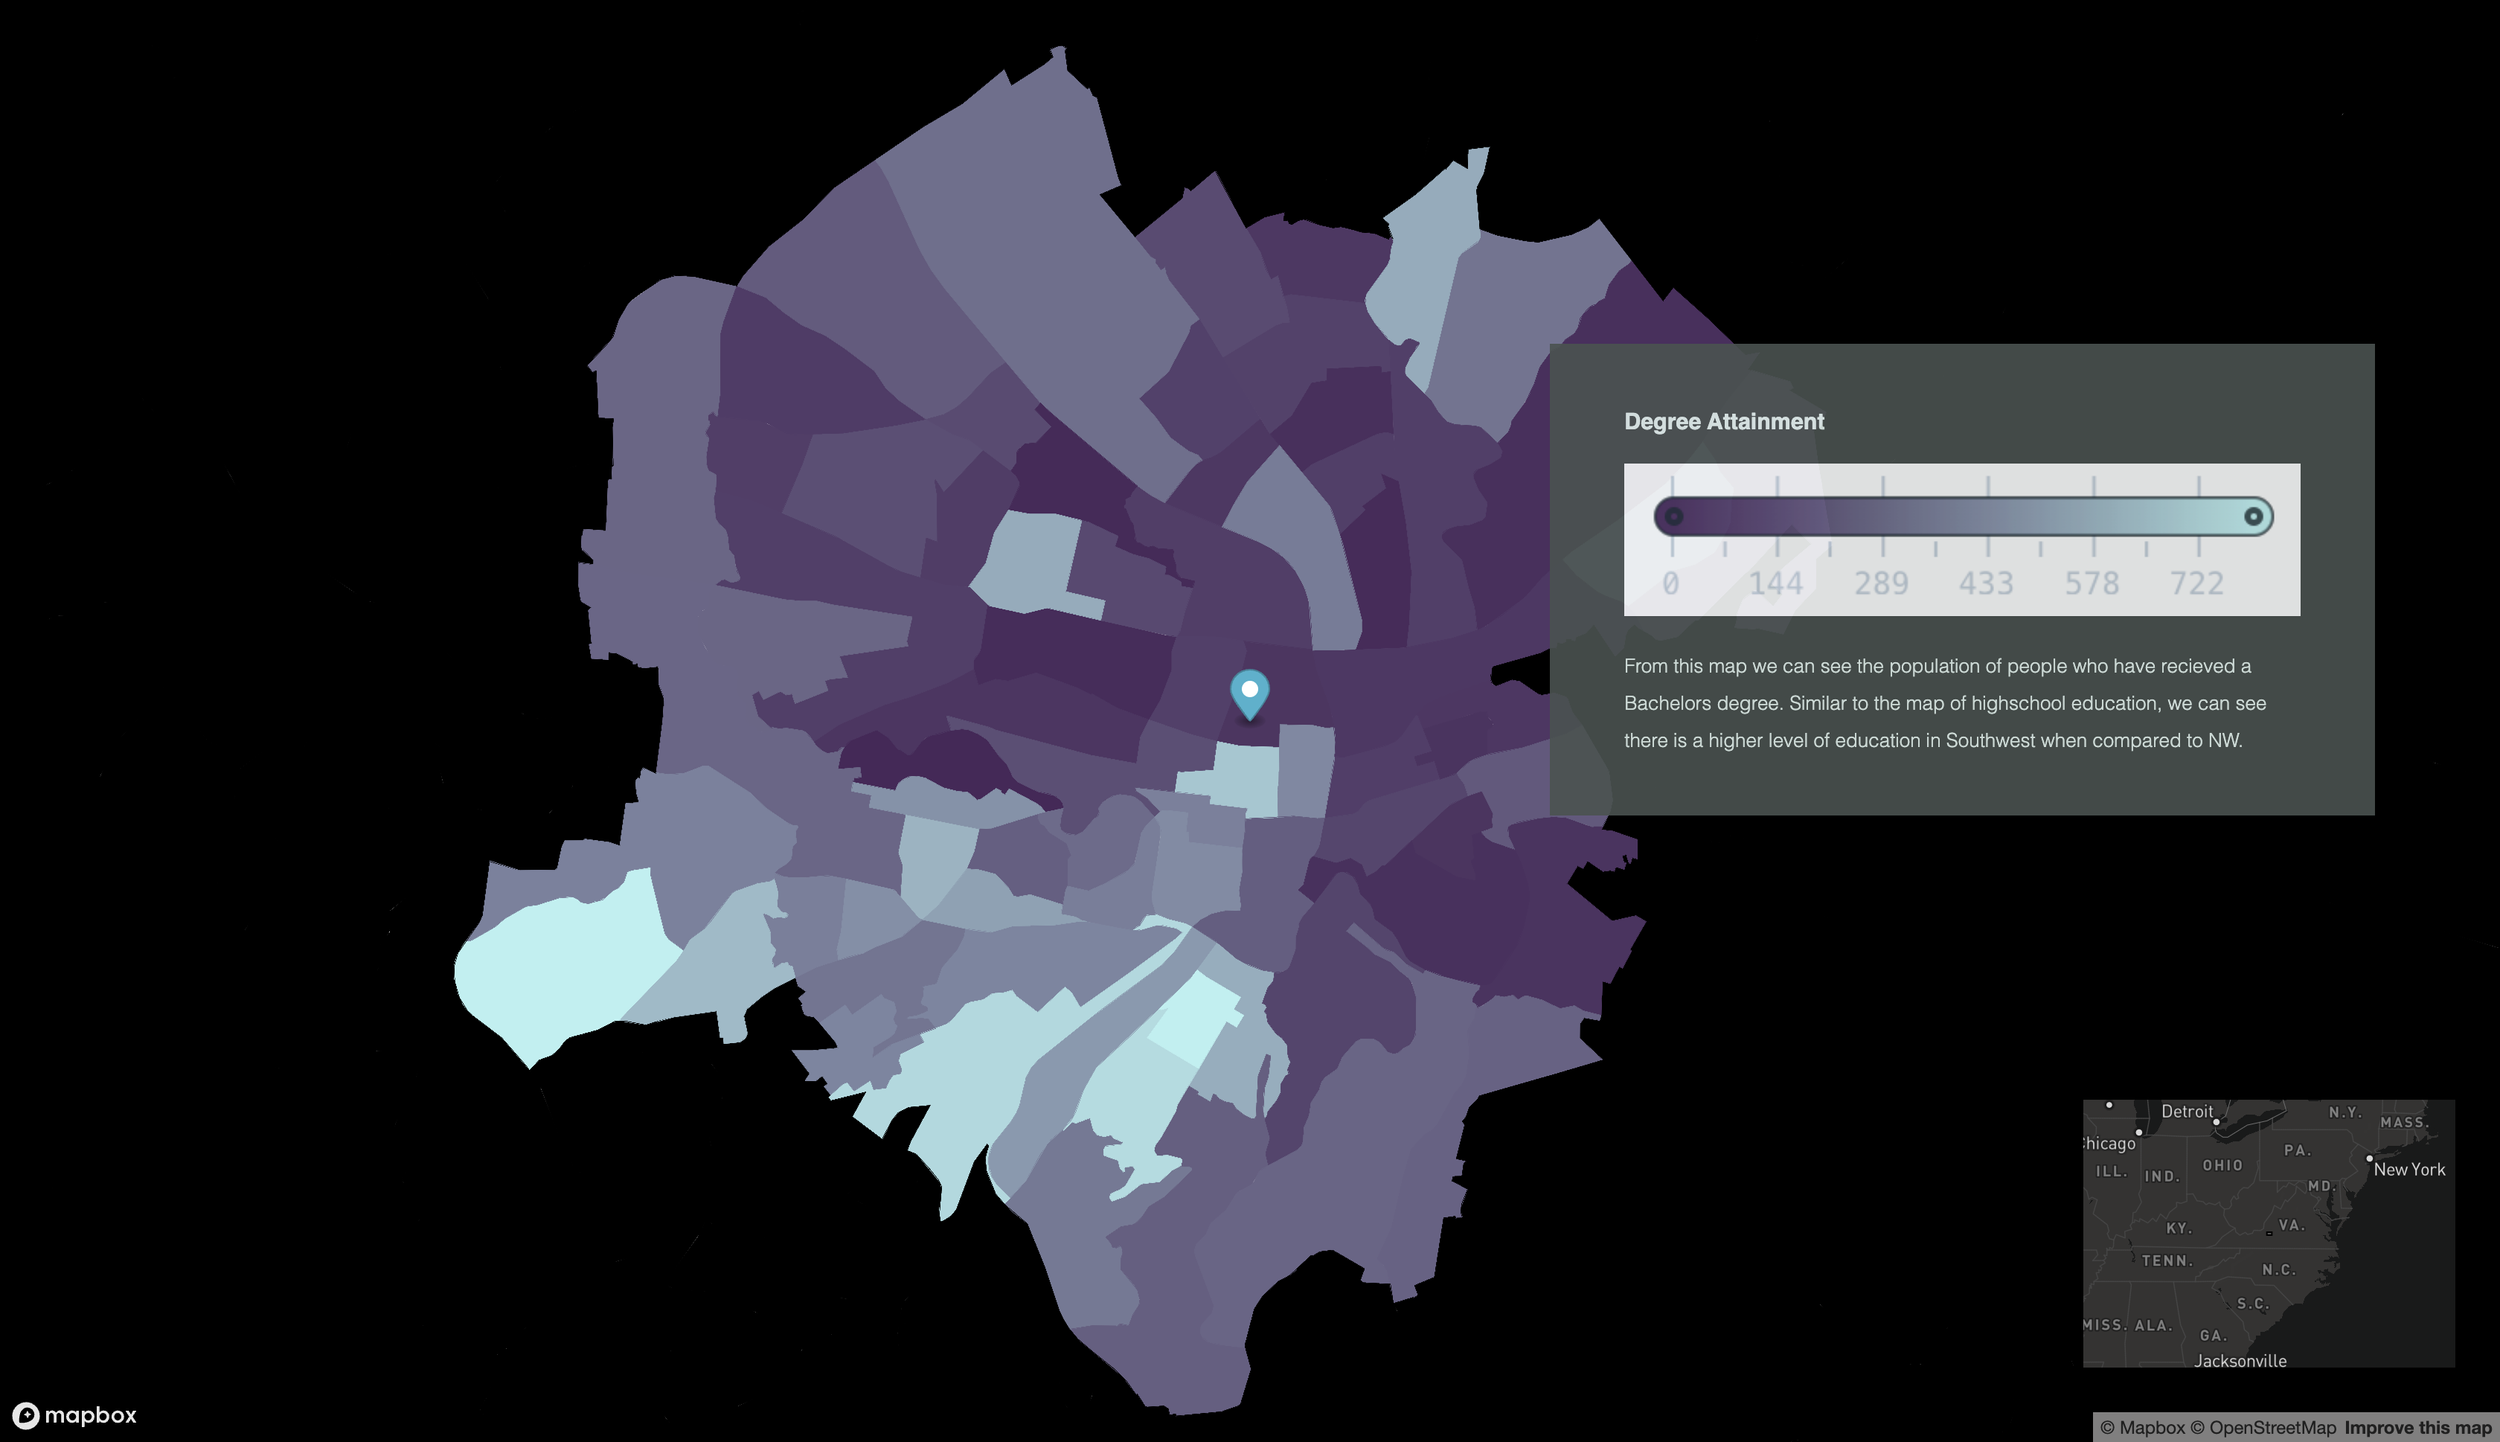
The second map (purple and blue) analyzes the same geographical area, but specifically identifies degree attainment. The qualification for “degree attainment” is a Bachelors degree from a credited university. In this map, purple represents low levels of degree attainment and blue represents high levels of degree attainment. Similarly to the map of highschool education attainment, bachelors degree levels were least prominent in the Northern part of Roanoke County, once again verifying the correlation between educational attainment and the localized segregation caused by the Norfolk Southern Railway.
__________________________________________________________________
Interactive Website | Scrolly-Map
To present all the information and data I collected, I coded a Scrolly-Map template using the Visual Studio Code software and importing that code into MapBox. The code used HTML and CSS, and allowed me to personalize color and font-pairings, as well as fade-in and fade-out transitions.
__________________________________________________________________
Income and Poverty Levels
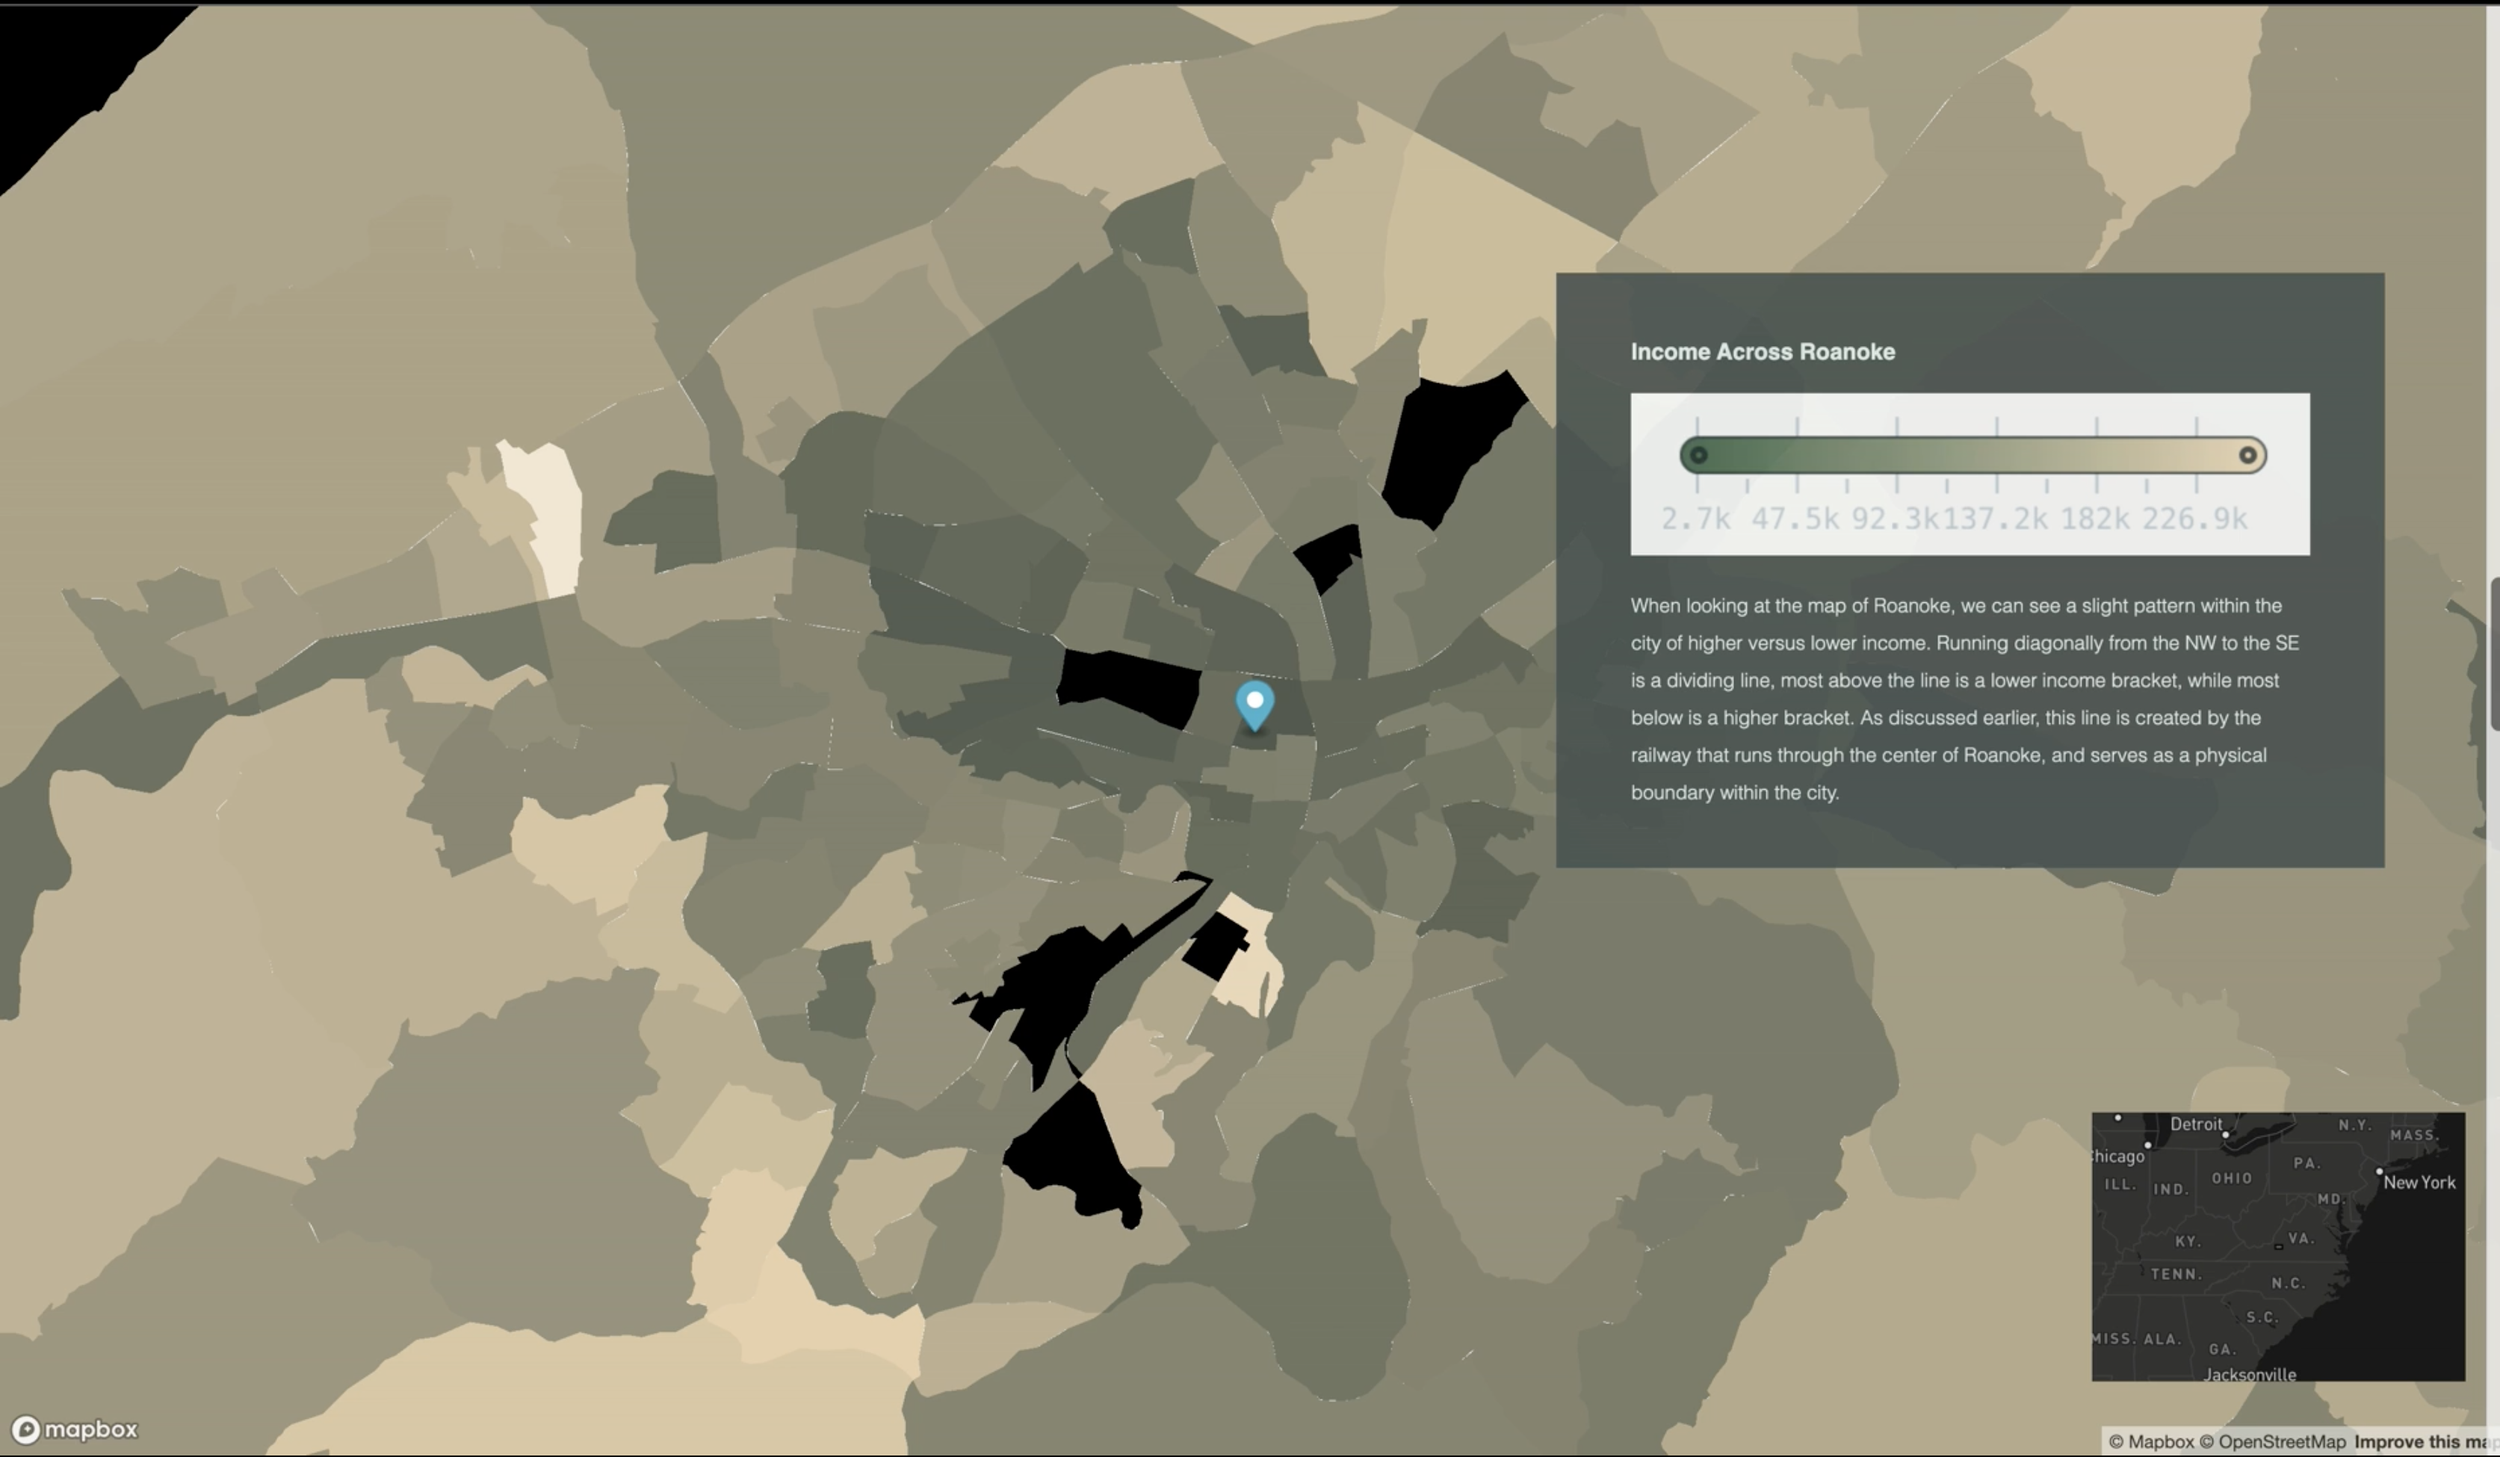
Income and salary levels are good predictors of lifestyle and well-being in geographical neighborhoods. Using the census data I collected for income and poverty I was able to create two maps that show the greater geographical region of the Roanoke Valley.
When analyzing the income map there is a noticeable divide above and below the blue location marker (Norfolk Southern Railroad). Above (North Roanoke) there is an overwhelming amount of green and dark green block-groups. This shows that in the Northern Roanoke area, income is very low, especially in comparison to the southern part of the region.
When looking at income and poverty it is important to recognize that the poverty depicted in the maps is based on concentrated poverty rates, which means that the average poverty of the area is below the national and state average, this definition essentially emphasizes that these poverty-ridden areas are not only living with low incomes, but significantly lower than the average household and living wage/salary.
In the purple map, dark purple represents high levels of concentrated poverty, while light purple represents low/no levels of concentrated poverty (livable/wealthy wages). Consistent with the income map, above the blue location marker (Northwest Roanoke) has very low levels of income and very high levels of concentrated poverty.


